SF buoy spectrum
California Buoy spectrum
SE Papa buoy spectrum
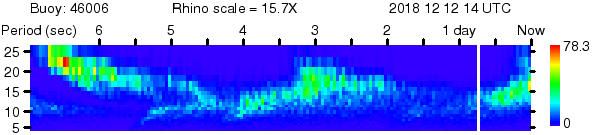
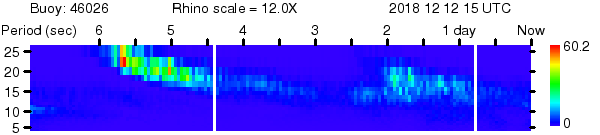
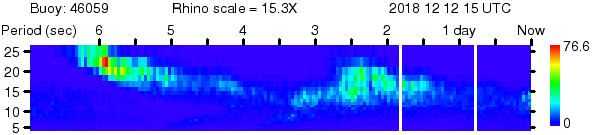
Buoy raw energy is taken from the buoy web sites in m*m/Hz.
These values are plotted as a function of wave period instead
of wave Hz because wave period is proportional to wave
velocity, and wave period squared is proportional to wave
energy. There are 3 fixed scales at 5,10, and 15 m*m/Hz. The
fourth scale is rhino, and it self-adjusts depending on the
largest swell energy entry.
Let me know if you have
any feedback/ideas All copyright on plots reserved -
email me if you want to use these plots or their source in
perl. The programs also require ghostscript,lynx, and date.
So think UNIX/linux/*BSD.