All the links I use are on my page.
Stormsurf has a tutorial and a
do your own prediction page, too.
This page provides a basic explanation of the mechanisms that
underly the waves we surf from their generation to their
cresting. The winds thousands of miles away create a ripple, and
five days later you are driving around a bottom turn and pulling
into a tube. But how can you learn to tell when surf will hit
your beaches? This page is here to help. This page will explain what
a wave group is, how to identify a significant swell, how to
determine if the winds are pointing at your beach, guesstimating
the dominant wave period, arrival time, arrival size, how to use
local buoys to refine predictions, and some brief notes on
predicting local winds. But first, wave groups.
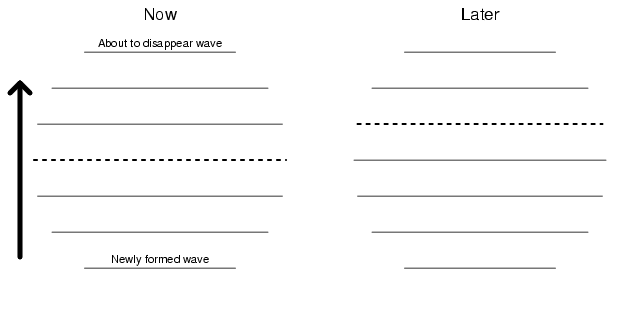
Wave groups - how waves travel
The waves we surf locally are wind
generated. When wind blows over water, it creates waves that
travel in the direction of the wind. As each waves passes through
water, it causes the local water to move in a circular pattern.
Down and back, then up, then forward, then down and forward. This
circular pattern creates momentum. Because each individual wave
creates its own momentum pattern that is matched by the momentum
pattern of other waves at the same speed, waves will tend to
synchronize with each other and form wave groups. These wave
groups are a wave train, a set of waves travelling together. The
group moves in the same direction as the wave, at half the wave
speed. Within the group, each wave moves forward from the back of
the group to the front. At the front, the wave has to create
momentum from water that has none, so the front wave gradually
disappears. At the back of the group, the wave leaves the water
with some momentum that gradually builds into a wave. The waves
in the middle share in the transfer of momentum, and do not
change in size, but move within the group. Waves move, like on a
conveyor belt, from the back of the group to the front.
Wave group conceptual
If you ever have a chance to fly over a solid swell, you can
watch wave groups travel, and waves moving within the group. If
the groups are well-separated, and the swell clean, these groups
become sets of waves at the beach. The number of waves per set is
based on how "fully developed" the seas become. If the wind is
consistent in direction and velocity for a long time, over a
large area, the wind will create lots of single wave travelling
at the same speed. As they synchronize with one another, the wave
groups will increase in the number of waves per group. With
particularly well developed seas, wave groups with 10+ waves can
result. More often, there are fewer waves per group, and the
storm has variable winds from hour to hour and mile to mile which
prevent the seas from reaching a larger wave group size.
These groups of waves, formed by wind, will move in the same
general direction as the winds. As a rule of thumb, the wave
groups will spread about 30 degrees in either direction from the
mean source wind direction. The wave density, at the beach, is a
function of area of waves generated, and the inverse of the
square of the distance from the beach. Larger storms generate
more dense swells at the beach, and further away storms generate
less dense swells at the beach.
The really important things to know about wave groups are that
the wave groups travel at roughly half the wind speed, and the
waves travel twice as fast as the group.
The entire point of predicting swells from far away is finding
winds over the ocean that are blowing at you with an adequate
velocity, and then calculating the arrival time based on wind
speed.
Finding a significant swell
Let's start a prediction run. I watch the FNMOC models for the Pacific Ocean, NGP,
Previous 12-hr Precipitation Rate [mm/12hr] and Sea Level
Pressure [hPa], and look for low pressure systems. Low pressure
systems usually come with winds, and create swell. Sometimes I
find swell generators on QuikSCAT instead.
Quikscat is a scatterometry site - they take "roughness" readings
over the ocean and use them to estimate the winds. It is
important to note their data is based on waves - not winds. But,
they present their data interpreted as wind data.
Suppose I find someplace where winds are over 40 knots covering a
substantial area, and the WWIII Zero time model shows seas over
25 feet. I need to know a few things. First, are the winds really
pointing at us. Second what wave period can I expect. Third, when
will it get here. Fourth, how big will it be when it arrives.
Are the winds pointing at me?
Now, with a load of waves over the ocean, I need to know if they
are coming my way. For that, you need to
understand the big circle. Most radar and maps are mercator plots
- every 1 by 1 degree latitude-longitude square looks the same
size. That would work if the world were flat. But it is not.
So, many years ago, the concept of traveling by the "Great
Circle" was developed. The concept basically lets you use
coordinates, and uses a globe (or ellipse) model of the earth.
With an appropriate "Great Circle" calculator, you plug in
latitude and longitude of the starting and stopping points, and
it gives you the heading from each point, and distance. Here
is my favorite. Actually, my favorite is the program "geod" from
the government here. The program is
really anal about formatting - the web page is easier to use. In
any case, it is useful to see, for example, that a swell on the
dateline at 45 degrees N latitude needs a heading of 75 degrees
(ie: north east) to come into San Francisco at 305 degrees (or
from the northwest). If that seems confusing, think about it this
way. If you start in Alaska and head north, after you cross the
pole you are heading south. We live on a globe, not a mercator
plot of the earth.
Using a Great Circle calculator, I plug in the coordinates for
San Francisco, and for the
center of the swell mass. Here is a
closeup of
the storm winds.


San
Francisco is at 37d45'N 122d49'W, the swell origin is close to
54d00'S 124d00'W. Use the position in the swell where the wave
models show the largest waves are being generated. Do not use the
positions where the winds are pointing in exactly the right
direction. The winds will generate waves with a splay of about 30
degrees in either direction, so the angle is like horseshoes and
hand grenades - close is good enough. Use the strongest position
in the swell, it will generate the longest period waves. The
calculator tells me something like this
echo 37d45'N 122d49'W 54d00'S 124d00'W | geod +ellps=WGS84 -p
-I +units=kmi
OUTPUT: 180d41'56.584" 0d56'22.202" 5489.364
This calculator is the geod calculator provided by the USGS. The
output says this swell is coming from 180 degrees. The winds at
origin need to be pointing at 1 degree, or due
north. And the swell is 5490 nautical miles away. I go back and
check the QuikSCAT plot to see if the winds are actually blowing
close to 1 degree. THEY ARE!!! Hurray - a swell is coming - but
when??? And how big???
What is the wave period?
There are two complementary approaches to determining the wave
period. The first is to look at the QuikSCAT data and estimate
directly from it. In this example, we would see at the center of
the winds pointing at us, that winds are in the 40-50 knot range.
This means if the seas fully develop, the swell should be
predominantly 14 and 17 second wave periods.
The basic relation between wave period and
wind speed is in the following table
| Wind Speed (knots) | Period Generated |
|---|
| 30 | 11 sec |
| 37 | 13 sec |
| 42 | 14 sec |
| 50 | 17 sec |
| 60 | 20 sec |
The second approach
is to look at the WWIII Time Zero model run. This is the current
wave heights. Look at 124W 54S
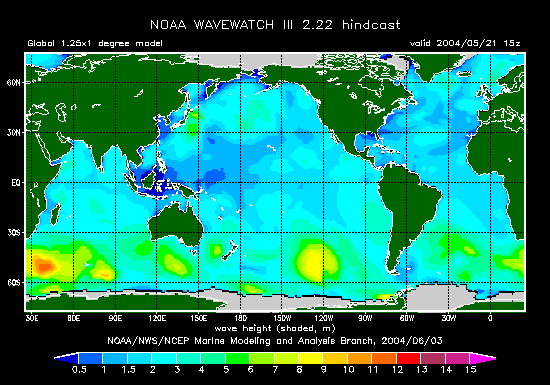
Wave heights in the 24 to 27 foot range will generate
predominantly 14 second wave periods, with some 17 second, and
some 12 second periods. Wave heights close to 35 feet at origin
will have periods of 17 seconds, with some 20 and 14 second
energy. At 45 feet, it is mostly 20 second energy, with some 25
and 17 second energy. In the case of our example swell, we
estimate mostly 14 second energy, with some 17 and 12 second
energy.
When will it get here?
Now I take the 5489 nautical miles and my handy dandy calculator
and divide by 26.52, 21.84, and 19 nautical miles/hr. I get
| Wave Period (sec) | Arrival time (Days) |
|---|
| 17 | 8 days 14 hours |
| 14 | 10 days 11 hours |
| 12 | 12 days 0 hours |
We should start to see swell in 8.5 days, and see some swell for
another 4 days.
Table relating swell period to speed. Please note that these
speeds are the transit speeds, or wave group speeds. The
individual waves in the group will move at twice the group speed.
| Period (in seconds) | Speed (knots) |
|---|
| 11 | 17.16 |
| 13 | 20.28 |
| 14 | 21.84 |
| 17 | 26.52 |
| 20 | 31.2 |
How big will it be?
Now for swell attenuation. The basics are that swells lose 25% of
their height for each travel day. In addition, as swells approach
shallower water, the circular motion of the water will begin to
be interfered with by the ocean bottom, and the swell will lose
even more energy. So, we use the basic formula,
Swell height at origin * 0.75^(num days travel) * 0.75
The last factor, the 25% loss in height locally, is specific to
San Francisco. Different locations will lose more or less, in
relation to how much "shallow" water there is on the way to the
beach. But back to our example.
Assume 26 ft seas at origin. After 8 days the swell should be
down to 2.6 ft 17 seconds. After 10 days, a little under 2 ft 14
seconds. As it turned out, this swell generated waves
continuously for several days, and the peak energy came in close
to 3 feet 14-17 seconds. Predictions more accurate than this may
be obtained, but only if the swell is plotted day-by-day, and the
variability in wind attenuation factored in. The 25% loss in wave
height each day is due to wind resistance. Don't forget these 17
second period waves are moving through the air at 50 miles per
hour! A substantial wind impacting a travelling swell will have a
large impact. More than 30 knot cross or headwinds will attenuate
a swell 40 to 50%, instead of the normal 25%. A tailwind of 20
knots will allow no swell attenuation at all in a day.
Another point to keep in mind is something I mentioned earlier.
The winds at the source need to be consistent. You will rapidly
get a hang of this if you plot fetches for each 12 hour period
(or each QuikSCAT pass). If the fetch moves towards you, in 12
hours, by about 300 miles, this is perfect. The fetch is moving
at close to the same speed as the swell. The swell size will be
larger, and longer period, than otherwise expected, because the
seas will more fully develop. If the fetch, on the other hand,
forms and degrades rapidly, or moves too fast, seas will be
smaller than otherwise forecast.
Some other details
As mentioned above, the swell will also lose energy in shallow
water. What is considered shallow? Well, the wave groups cause
circular motion of the water, to a depth of roughly half the wave
period. So, when the water depth gets shallow relative to half
the wave spatial period, the swell will start to lose energy.
More energy is lose the more shallow ocean floor is crossed.
Table relating swell period to wavelength. Each value is twice
the distance travelled at that swell velocity in one swell period
multiplied by two (the two factor is from the wave-to-swell
velocity difference).
| Period (sec) | Wavelength (feet) |
|---|
| 11 | 636 |
| 13 | 890 |
| 14 | 1030 |
| 17 | 1520 |
| 20 | 2100 |
So, for a 20 second swell, even 500 feet of water will cause
significant swell attenuation, and refraction. This is terminal
for the US East Coast spots, as the continental shelf will scrub
the longer period swells down to nothing. In San Francisco, we
lose another 25% of swell height due to the relatively brief
continental shelf. Longer period swells will lose less
attenuation travelling from their source to the near-deep water
because they spend less time in transit. But, they will lose more
size when they approach shore, as they "feel" the ocean floor
deeper than shorter period swells. The swell spots that really
pump have water 2 km deep as close as possible to shore.
If you've grasped these concepts, start charting swells and
taking notes, and you will be able to predict swell conditions
with the best. I am completely serious, this is all there is
to it. But take notes, and try to find out why your predictions
are off, when they are off.
Refining predictions using buoys
What has been described, so far, is a way to use the source data,
wave heights and wind speeds, and use them to predict the swell.
Of course, the prediction runs without further input of data, and
there can be more than a week of uncertain weather conditions en
route to your beach. So, it is important to use buoy data to
refine your predictions.
For any direction of swell, look for a buoy it will hit on the
way. A 230 degree south swell will come straight to use from the
Christmas Island Buoy. A 290 degree NW swell comes straight
through the SE Papa buoy. A 270 degree swell comes through the
California buoy. A 180-190 degree south swell will hit Southern
California buoys about a half day before it hits us. By using
the raw spectral data and directional data, when
available, from these buoys, you can anchor a prediction in the
12 to 40 hours before it reaches your shore. The Great Circle
calculator can tell you the distance from the buoy to you, and
its direction, and you can use the data from the tables on this
page to tell you how long each period will take to reach you from
the buoy. With local buoy refinements, you can estimate swell
arrival time within an hour, and height within 10% of actual
height, which is much better than any wave forecaster can
do with only swell origin data.
Wind prediction
First of all, let me tell you, charting swells is NOTHING
compared to trying to predict local winds in SF. I am BAD at it.
But, I see nothing else doing much better, so here is what I use.
First, the NWS marine forecast has a wind forecast. If it says
"winds less than 10 knots and variable", then we are ON. No winds
morning or afternoon, probably high pressure is in place. If it
says "Winds NW less than 15 knots", then we'll probably, but not
definitely, have null winds in mornings and problems in
afternoons. NW winds 15-25 (or more) knots is BAD NEWS. Anything
NE or SE or E will blow close to straight offshore. The local
climatology focuses things directly onshore or offshore. Anything
remotely offshore will blow pretty much right into the wave face.
Okay, NWS forecast gives us SOME idea of winds out to 2 days. But
further than that I use the FNMOC model. The model has wave
heights and wind vectors on the same page. If the wave heights
show a little area of light blue and elevated wave heights right
at the coast, that is usually a high pressure driven local wind
gradient - windswell, and usually bad winds at the beach. If
there are no wind vectors anywhere near SF, that is high
pressure, and good winds morning and afternoon.
Also, use pressures to help you out. Higher pressure over the
Great Basin (eastern Nevada, western Utah, southwest Idaho) is
our preferred offshore wind pattern. Lower pressure over land,
and high pressure over the ocean, usually means onshores.
Hope this helps.
blakestah AT blakestah DOT com